Eradicating Poverty as a Never-Ending Task
Why in the News
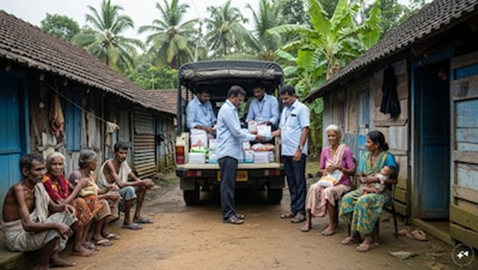
Recently, marking its 69th formation day, Kerala announced that it had achieved the milestone of eradicating extreme poverty under the Extreme Poverty Eradication Programme (EPEP). This announcement followed a four-year-long mission launched in May 2021 by the LDF government led by Chief Minister Pinarayi Vijayan.
Background
- Kerala has long been recognised for its exemplary record in social and human development, with healthcare systems comparable to developed nations.
- The State has achieved consistent reductions in poverty — from 59.8% in 1973-74 to 11.3% in 2011-12, owing to people-centric development and decentralised planning.
About the Extreme Poverty Eradication Programme (EPEP)
- The EPEP, launched in May 2021, aimed to identify and uplift families living in extreme poverty through targeted interventions.
- The initiative was spearheaded by the Local Self-Government Department and involved extensive community participation through Kudumbashree workers and local bodies.
Implementation Process
- The government deployed around 4 lakh trained enumerators for household-level identification.
- Based on four key poverty criteria — food, health, housing, and livelihood —
64,006 families (1,03,099 individuals) were identified as extremely poor. - A uniform welfare scheme was deemed inadequate; hence, individualised micro plans were prepared for each family.
- Assistance included cooked meals, palliative care, essential medicine, housing, and livelihood support.
Key Achievements
- NITI Aayog’s National Multidimensional Poverty Index (2023) ranked Kerala as the least impoverished state, with just 0.55% of the population identified as multidimensionally poor (national average: 14.96%).
- Kerala’s approach emphasised grassroots-level planning, community involvement, and welfare-oriented governance
Challenges and Criticism
- Experts argue that poverty eradication is a continuous process, not a one-time achievement.
- Critics point to issues such as:
- The plight of tribal populations still facing deprivation.
- Stagnant growth and rising unemployment under the so-called Kerala Model.
- To address relapse, the government has launched EPEP 2.0, focusing on preventing families from falling back into poverty.
Way Forward
- The State plans to integrate EPEP 2.0 with major infrastructure projects and green industries to promote sustainable growth.
- Emphasis is on welfarism with growth, ensuring social safety without compromising sustainability.
- Kerala’s community-driven model, though imperfect, is inclusive, participatory, and a replicable development paradigm for other states
Significance
- Kerala’s initiative demonstrates that progressive governance can blend economic growth with social equity.
- It reinforces the idea that eradicating poverty is not a destination but a continuous mission, rooted in empowerment and sustainability.
Understanding Poverty in India
- Poverty refers to a situation or condition in which an individual or community lacks the financial means and essential resources required to maintain a minimum standard of living. It signifies that a person’s income from employment or livelihood is so inadequate that basic human needs—such as food, shelter, clothing, healthcare, and education—cannot be fulfilled.
- In India, around 21.9% of the population was estimated to be living below the national poverty line as per the 2011 data.
- At the global level, nearly 8% of the world’s workers and their families in 2018 survived on less than USD 1.90 per person per day, which is the international poverty threshold set by the World Bank.
Global Perspective (World Bank Definition)
According to the World Bank, poverty is a form of pronounced deprivation in well-being, encompassing multiple dimensions:
- It includes low income levels and inability to obtain essential goods and services required for a life with dignity.
- Poverty is not limited to income deprivation; it also covers:
- Poor health and low educational attainment
- Limited access to clean water and sanitation
- Inadequate physical security and shelter
- Lack of voice and representation in decision-making
- Restricted opportunities and capabilities to improve one’s living conditions.
History of Poverty Estimation in India
Pre-Independence Phase: The idea of measuring poverty in India dates back to the colonial period. Dadabhai Naoroji was the first to attempt a systematic estimation of poverty in his landmark work “Poverty and Un-British Rule in India” (1901). He used the concept of a subsistence diet to assess the minimum income required to avoid starvation.
- The National Planning Committee (1938) and the Bombay Plan (1944) further explored ways to estimate poverty based on a minimum standard of living. These early efforts laid the foundation for post-independence poverty measurement in India.
Post-Independence Developments: After independence, India institutionalised poverty estimation through official mechanisms and expert committees.
- The Planning Commission (1962) initiated systematic efforts to estimate poverty levels in the country.
- V.M. Dandekar and N. Rath (1971) made a significant contribution by linking poverty estimation to consumption expenditure required to meet calorie norms, thereby introducing a more scientific basis for defining poverty.
- The Alagh Committee (1979), under Dr. Y.K. Alagh, formulated poverty lines based on the minimum consumption requirements and effective demand, using nutritional norms as the benchmark.
- The Lakdawala Committee (1993) recommended state-specific poverty lines based on price indices and continued the calorie-based approach while relying on consumption expenditure data from the National Sample Survey (NSS).
Post-2000s Revisions
- Tendulkar Committee (2009): The Tendulkar Committee was set up to review the existing methodology of poverty estimation and move beyond the traditional calorie-based approach.
- Key recommendations included:
- A shift away from calorie norms as the basis for poverty measurement, considering broader aspects such as health, education, and living costs.
- Adoption of a uniform all-India Poverty Line Basket (PLB) for both rural and urban areas, replacing the earlier system of separate PLBs.
- Use of the Mixed Reference Period (MRP) instead of the Uniform Reference Period (URP) for consumption data, to capture more accurate expenditure patterns.
Based on these recommendations, the national poverty line for 2011–12 was estimated at ₹816 per capita per month for rural areas and ₹1,000 per capita per month for urban areas.
- Rangarajan Committee (2014): Following widespread criticism of the Tendulkar methodology, the Rangarajan Committee was constituted to revisit poverty estimation methods.
- Its key features included:
- A return to separate rural and urban poverty line baskets, acknowledging variations in consumption and cost of living.
- Derivation of state-level rural and urban poverty estimates based on these distinct poverty baskets.
- However, despite submitting its report, the Government of India did not formally adopt the Rangarajan Committee’s recommendations, and the Tendulkar methodology continues to serve as the official basis for poverty estimation.
Important Terminologies Related to Poverty
- Absolute Poverty
- Refers to a condition where individuals lack the minimum resources required to meet basic human needs such as food, safe drinking water, shelter, and clothing.
- It represents a fixed threshold of deprivation, determined without considering the social or economic context of a country.
- Essentially, it reflects the minimum cost of survival necessary to maintain a bare standard of living.
- Relative Poverty
- Defines poverty in comparison to others within the same society.
- Individuals are considered poor when their income or living standards fall below the average or accepted social norms of the community.
- It focuses on inequality and social exclusion, highlighting differences in access to resources and opportunities rather than sheer survival.
- Poverty Rate / Poverty Incidence / Headcount Ratio
- Indicates the proportion or percentage of the population living below the poverty line.
- It answers the question — “How many are poor?”
- This measure provides a simple overview of poverty prevalence, though it doesn’t capture how severe the deprivation is.
- Intensity of Poverty
- Measures the depth or severity of poverty among those identified as poor.
- It reflects the average shortfall from the poverty line, i.e., “How poor are the poor?”
- This indicator helps in understanding the extent of deprivation and designing targeted welfare interventions.
Some Indices to Measure Poverty
Some of the commonly used indices for measuring poverty include:
- Global Multidimensional Poverty Index (MPI)
- National Multidimensional Poverty Index (NITI Aayog)
- Bare Necessities Index (BNI) – Developed using data from the National Statistics Office (NSO) and Economic Survey 2020–21, it evaluates basic needs across five dimensions: water, sanitation, housing, micro-environment, and other essential facilities.
Global Multidimensional Poverty Index (MPI)
The Global Multidimensional Poverty Index (MPI) is a comprehensive global measure of poverty that captures multiple deprivations experienced by individuals across health, education, and living standards.
- It has been jointly released annually since 2010 by the United Nations Development Programme (UNDP) and the Oxford Poverty and Human Development Initiative (OPHI).
- Report Highlights
- In India, approximately 21.9% of the population was estimated to be living below the national poverty line as per the 2011 data.
- At the global level, around 8% of workers and their families in 2018 lived on less than USD 1.90 per person per day, the international poverty benchmark defined by the World Bank.
- These figures underline that, despite economic progress, income deprivation and working poverty continue to remain major global concerns.
Methodology
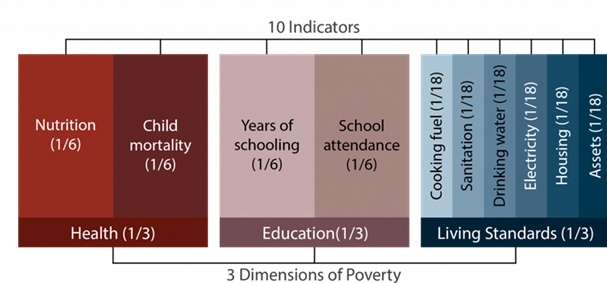
- The MPI framework assesses poverty through three key dimensions — Health, Education, and Living Standards — measured across 10 specific indicators.
- A household is considered multidimensionally poor if it is deprived in at least one-third of these weighted indicators
Key Dimensions and Indicators
1. Health
- Nutrition: A person under 70 years of age is considered deprived if he or she is undernourished based on available nutritional data.
- Child Mortality: A household is deprived if any child under 18 years has died within the past five years preceding the survey.
2. Education
- Years of Schooling: Deprivation occurs if no eligible household member has completed at least six years of formal schooling.
- School Attendance: A household is deprived if any school-age child is not attending school up to the age when he or she should complete Class 8.
3. Living Standards
- Evaluates access to basic amenities such as:
- Clean cooking fuel
- Improved sanitation facilities
- Safe drinking water
- Adequate housing
- Electricity access
- Ownership of basic assets
Significance
- The MPI goes beyond income-based measures by offering a multidimensional view of poverty, capturing overlapping deprivations that people face simultaneously.
- It helps governments and international agencies design targeted interventions for inclusive and sustainable development.
National Multidimensional Poverty Index (MPI) – India
The National Multidimensional Poverty Index (MPI) is India’s indigenised measure of poverty developed to monitor the performance of States and Union Territories in reducing multidimensional poverty.
- The NITI Aayog serves as the nodal agency for constructing and publishing this index, adapting the global MPI framework to India’s context.
- To institutionalise the process, NITI Aayog constituted an Inter-Ministerial MPI Coordination Committee (MPICC) with representation from various ministries related to health, education, nutrition, rural development, sanitation, drinking water, electricity, and urban development.
MPI Coordination Committee (MPICC)
- The MPICC, supported by institutions such as the International Institute for Population Sciences (IIPS) under the Ministry of Health and Family Welfare, played a central role in ensuring technical precision and data reliability.
- It also included:
- Experts from the Ministry of Statistics and Programme Implementation (MoSPI)
- Technical partners like the Oxford Poverty and Human Development Initiative (OPHI) and the United Nations Development Programme (UNDP)
- The cross-sectoral composition of the committee allowed integration of perspectives from diverse sectors to better align policy interventions with household-level realities.
Dimensions of India’s National MPI
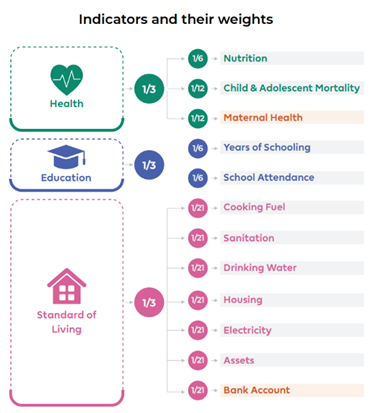
- The National MPI, like the Global MPI, is built around three equally weighted dimensions:
- Health
- Education
- Standard of Living
- Together, these are represented by 12 indicators reflecting multiple aspects of deprivation.
Sub-Indices of the National MPI
- Headcount Ratio (H) – “How many are poor?”
- Represents the proportion of multidimensionally poor individuals in the total population.
- Calculated by dividing the number of multidimensionally poor persons by the total population.
- Intensity of Poverty (A) – “How poor are the poor?”
- Measures the average proportion of deprivations experienced by those identified as multidimensionally poor.
- Computed by dividing the sum of weighted deprivation scores of all poor individuals by the total number of poor persons.
- MPI Value:
- The National MPI score is derived as:
👉 MPI = H × A - This captures both the incidence and intensity of poverty in the population.
Key Highlights of the Report
1. Steep Decline in Poverty
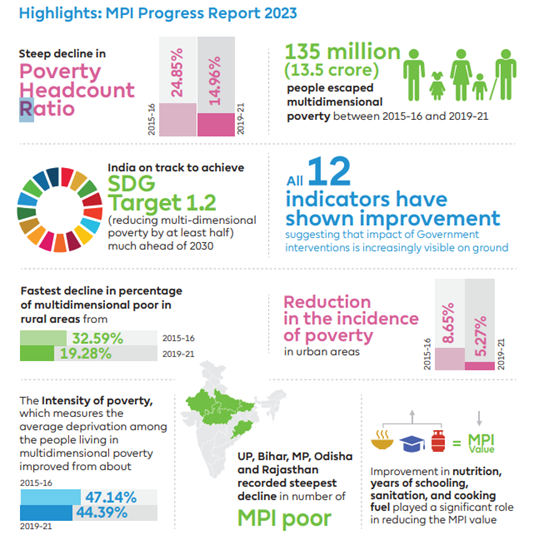
- India recorded a significant reduction in both its MPI value and Headcount Ratio between 2015–16 and 2019–21, reflecting the effectiveness of its multi-sectoral poverty alleviation approach.
- The proportion of multidimensionally poor fell from 24.85% to 14.96% during this period — a decline of 9.89 percentage points.
- Approximately 135.5 million people moved out of multidimensional poverty between 2015–16 and 2019–21.
- Major contributing factors:
- Improved nutrition
- Increased years of schooling
- Enhanced access to sanitation
- Wider availability of clean cooking fuel
- These achievements demonstrate progress toward Sustainable Development Goal (SDG) 1.2 — to halve multidimensional poverty by 2030.
- India is well on track to achieve this target ahead of schedule.
- The Intensity of Poverty also declined from 47.14% to 44.39%, indicating improvement in living standards among the poor.
2. Rural–Urban Disparities
- Rural areas still exhibit higher poverty levels, yet they have shown faster progress in poverty reduction.
- Rural poverty declined from 32.59% (2015–16) to 19.28% (2019–21).
- Urban poverty decreased from 8.65% to 5.27% during the same period.
- The decline has been pro-poor, with rural households benefiting the most in absolute numbers.
3. State-wise Trends
- Uttar Pradesh (UP) led with 3.43 crore people escaping multidimensional poverty, followed by Bihar (2.25 crore) and Madhya Pradesh (1.36 crore).
- Bihar, which had the highest MPI value in 2015–16, witnessed one of the fastest reductions, along with UP and MP.
- These states collectively contributed substantially to India’s overall poverty reduction.
4. District-level Insights
- The MPI’s disaggregated data allows district-level analysis, offering a granular view of local deprivation patterns.
- The most rapid poverty reduction occurred in districts across Madhya Pradesh, Gujarat, Uttar Pradesh, and Rajasthan, demonstrating the impact of decentralised policy implementation.
5. Indicator-wise Improvements
- All 12 indicators under Health, Education, and Standard of Living registered statistically significant improvements between the two survey periods.
- The most notable reductions were seen in:
- Sanitation deprivation: ↓ by 21.8 percentage points
- Cooking fuel deprivation: ↓ by 14.6 percentage points
- Other key contributors included better nutrition and schooling outcomes, underscoring progress in both human development and living conditions.
Status of Poverty in India (NITI Aayog)
- Poverty Headcount Ratio decreased from 29.17% (2013–14) to 11.28% (2022–23).
- Around 24.82 crore people have escaped multidimensional poverty in the last 9 years.
- Poorer states are experiencing a faster decline in poverty, showing reduction in regional disparities.
- States with the fastest reduction in multidimensional poverty include Uttar Pradesh, Bihar, Madhya Pradesh, Odisha, and Rajasthan.
- India is on track to achieve SDG Target 1.2 (halving multidimensional poverty) well before 2030.
Key Factors Contributing to Poverty in India
- Rapid Population Growth: A fast-growing population strains limited resources, leaving many deprived of basic necessities.
- Low Agricultural Productivity: Small and fragmented land holdings, outdated farming techniques, and obsolete technology reduce agricultural output, lowering incomes and increasing vulnerability to poverty.
- Limited Education: Lack of education perpetuates the poverty cycle, as individuals are unable to access better opportunities or afford basic needs.
- Insufficient Employment Opportunities: Job creation has not kept pace with population growth, and low levels of skill development exacerbate unemployment and underemployment.
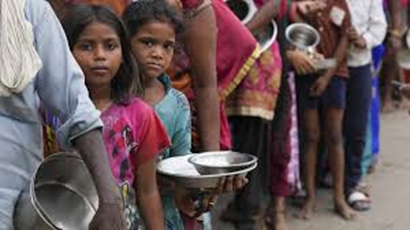
- Poor WASH (Water, Sanitation, and Hygiene) Facilities: Rural populations, urban slum dwellers, and people in disaster-prone areas face heightened poverty due to inadequate access to clean water, sanitation, and hygiene.
- Climate Change: Environmental changes disproportionately affect the poor, who lack access to information, infrastructure, and resources to cope with climate risks.
- Social Inequalities: Caste, class, and traditional societal structures make certain groups more vulnerable to poverty.
- Low Per Capita Income: As a developing country, India has a low per capita income, with many individuals surviving on less than $2 per day.
Developmental Challenges Arising from Poverty in India
- Poor Health Outcomes: Limited access to healthcare, clean water, and sanitation leads to health issues.
- Example: India has the highest number of stunted children globally, accounting for nearly a third of the total (Global Nutrition Report, 2020).
- Restricted Access to Education: Children from impoverished families often drop out to work, particularly affecting girls, which perpetuates the poverty cycle.
- High Infant Mortality Rates (IMR): Poverty contributes to inadequate nutrition and healthcare, leading to higher infant deaths.
- Example: IMR is 35.2 according to NFHS-5 (2019–21).
- Social Exclusion: Poverty prevents full participation in social and economic activities.
- Rising Crime Rates: Economic deprivation may push individuals toward criminal activities as a survival strategy.
- Inadequate Housing and Sanitation: Poor living conditions and lack of clean water contribute to diseases like diarrhea and other waterborne illnesses.
- Gender Inequality: Women and girls are disproportionately affected, often denied education, forced into early marriage, or employed in insecure, low-paying jobs.
- Environmental Degradation: Poverty-driven overuse of natural resources and deforestation damages the environment.
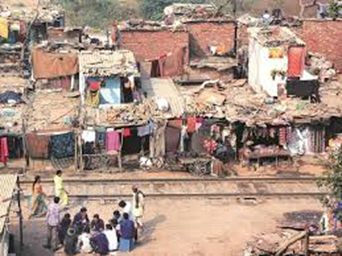
- Internal Migration: Poverty forces rural populations to migrate to urban areas in search of work, leading to growth of informal settlements and slums.
Relationship Between Demography and Poverty in India
- Population Growth Leading to Poverty:
- Increased competition for limited resources, leading to inequality.
- Greater pressure on infrastructure such as housing, sanitation, and healthcare.
- Higher unemployment due to mismatch between jobs and workforce.
- Poverty Leading to Demographic Change:
- Limited access to family planning results in high fertility rates.
- Lack of education and opportunities reduces informed decision-making about family size.
- Cultural and social norms encourage larger families.
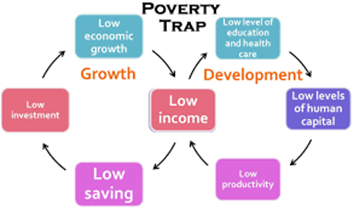
Overall: Poverty and demography create a vicious cycle, each reinforcing the other.
Measures to Reduce Poverty in India -Way Forward
- Investing in Education and Skills: Providing access to schooling and vocational training equips individuals for better-paying jobs.
- Promoting Economic Growth: Policies fostering entrepreneurship, innovation, and investment can generate employment and raise incomes.
- Ensuring Access to Basic Services: Availability of healthcare, clean water, sanitation, and electricity improves living conditions, especially in rural areas.
- Effective Social Protection Programs: Transparent implementation of cash transfers, food subsidies, and public distribution systems provides a safety net.
- Promoting Gender Equality: Empowering women through education, healthcare, and employment opportunities helps reduce poverty.
- Enhancing Agricultural Productivity: Modernizing agriculture and supporting farmers increases rural incomes.
- Addressing Income Inequality: Progressive taxation and inclusive policies can reduce economic disparities.
- Encouraging Inclusive Growth: Growth strategies that benefit all sections of society ensure sustainable poverty reduction.
Poverty Alleviation Programs in India
- Integrated Rural Development Programme (IRDP, 1978-79)
- Provided subsidies and bank credit to rural poor for productive employment; universalized from 1980.
- Jawahar Rozgar Yojana (JRY) / Jawahar Gram Samridhi Yojana
- Created employment in rural areas through economic and community infrastructure development.
- Indira Awaas Yojana (IAY)
- Offered free housing to Below Poverty Line (BPL) families in rural areas, with a focus on SC/ST households.
- Food for Work Programme
- Aimed at improving food security via wage employment; food grains supplied by the FCI to states.
- National Old Age Pension Scheme (NOAPS)
- Central government pension for senior citizens: ₹200/month for ages 60–79 and ₹500/month for 80+; implemented via local bodies.
- Annapurna Scheme (1999–2000)
- Provides 10 kg of free food grains per month to indigent senior citizens not covered under NOAPS.
- Sampoorna Gramin Rozgar Yojana (SGRY)
- Focuses on wage employment, rural infrastructure development, and food and nutrition security.
- Mahatma Gandhi National Rural Employment Guarantee Act (MGNREGA, 2005)
- Guarantees 100 days of employment per rural household annually; one-third of jobs reserved for women; unemployment allowance provided if work is not given within 15 days.
- National Rural Livelihood Mission – Aajeevika (2011)
- Forms village-level Self Help Groups (SHGs) to provide regular income and employment to rural poor.
- National Urban Livelihood Mission (NULM)
- Organizes urban poor into SHGs, promotes skill development, market-based employment, and supports self-employment with credit access.
- Pradhan Mantri Kaushal Vikas Yojana (PMKVY)
- Provides skill training to fresh labor market entrants, including school dropouts (Class X and XII).
- Pradhan Mantri Jan Dhan Yojana (PMJDY)
- Facilitates direct benefit transfers of subsidies, pensions, and insurance; targets unbanked poor and opened 1.5 crore bank accounts.
Conclusion
Poverty in India is multidimensional, shaped by economic, social, demographic, and environmental factors. While programs like MGNREGA, IRDP, NOAPS, Annapurna, and PMJDY provide support, sustainable poverty reduction requires investing in education, skills, and opportunities, as emphasized by Amartya Sen’s Capability Approach. Enhancing people’s capabilities, for example among slum dwellers, promotes entrepreneurship and ensures inclusive, empowering, and sustainable poverty alleviation.
UPSC MAINS PYQS
1. Critically examine whether a growing population is the cause of poverty, or whether poverty is the main cause of population increase in India. (2015)
2. “An essential condition to eradicate poverty is to liberate the poor from the process of deprivation.” Substantiate this statement with relevant examples. (2016)
3. Despite the implementation of various poverty alleviation programs by the government in India, poverty still persists. Explain the reasons behind this continued existence of poverty. (2019)
4. The COVID-19 pandemic accelerated class inequalities and poverty in India. Comment on the factors and consequences of this trend. (2023)